How to Use Revenue Dashboard for a Virtual Event in Zuddl
Last updated: March 24, 2026
The revenue dashboard lets you gain insight on how well your event performed on the basis on your customer journey in SFDC.
In order to use the Revenue dashboard, Salesforce integration is required as Zuddl fetches registrant data & activity data from Salesforce as well. Learn how to integrate your Zuddl account with Salesforce.
Org-level dashboard
If you are already using the Salesforce integration and are starting to use the revenue dashboard for the first time, follow the below instructions:
Go to the organization dashboard.
On the left navigation, go to Analytics > Revenue dashboard.
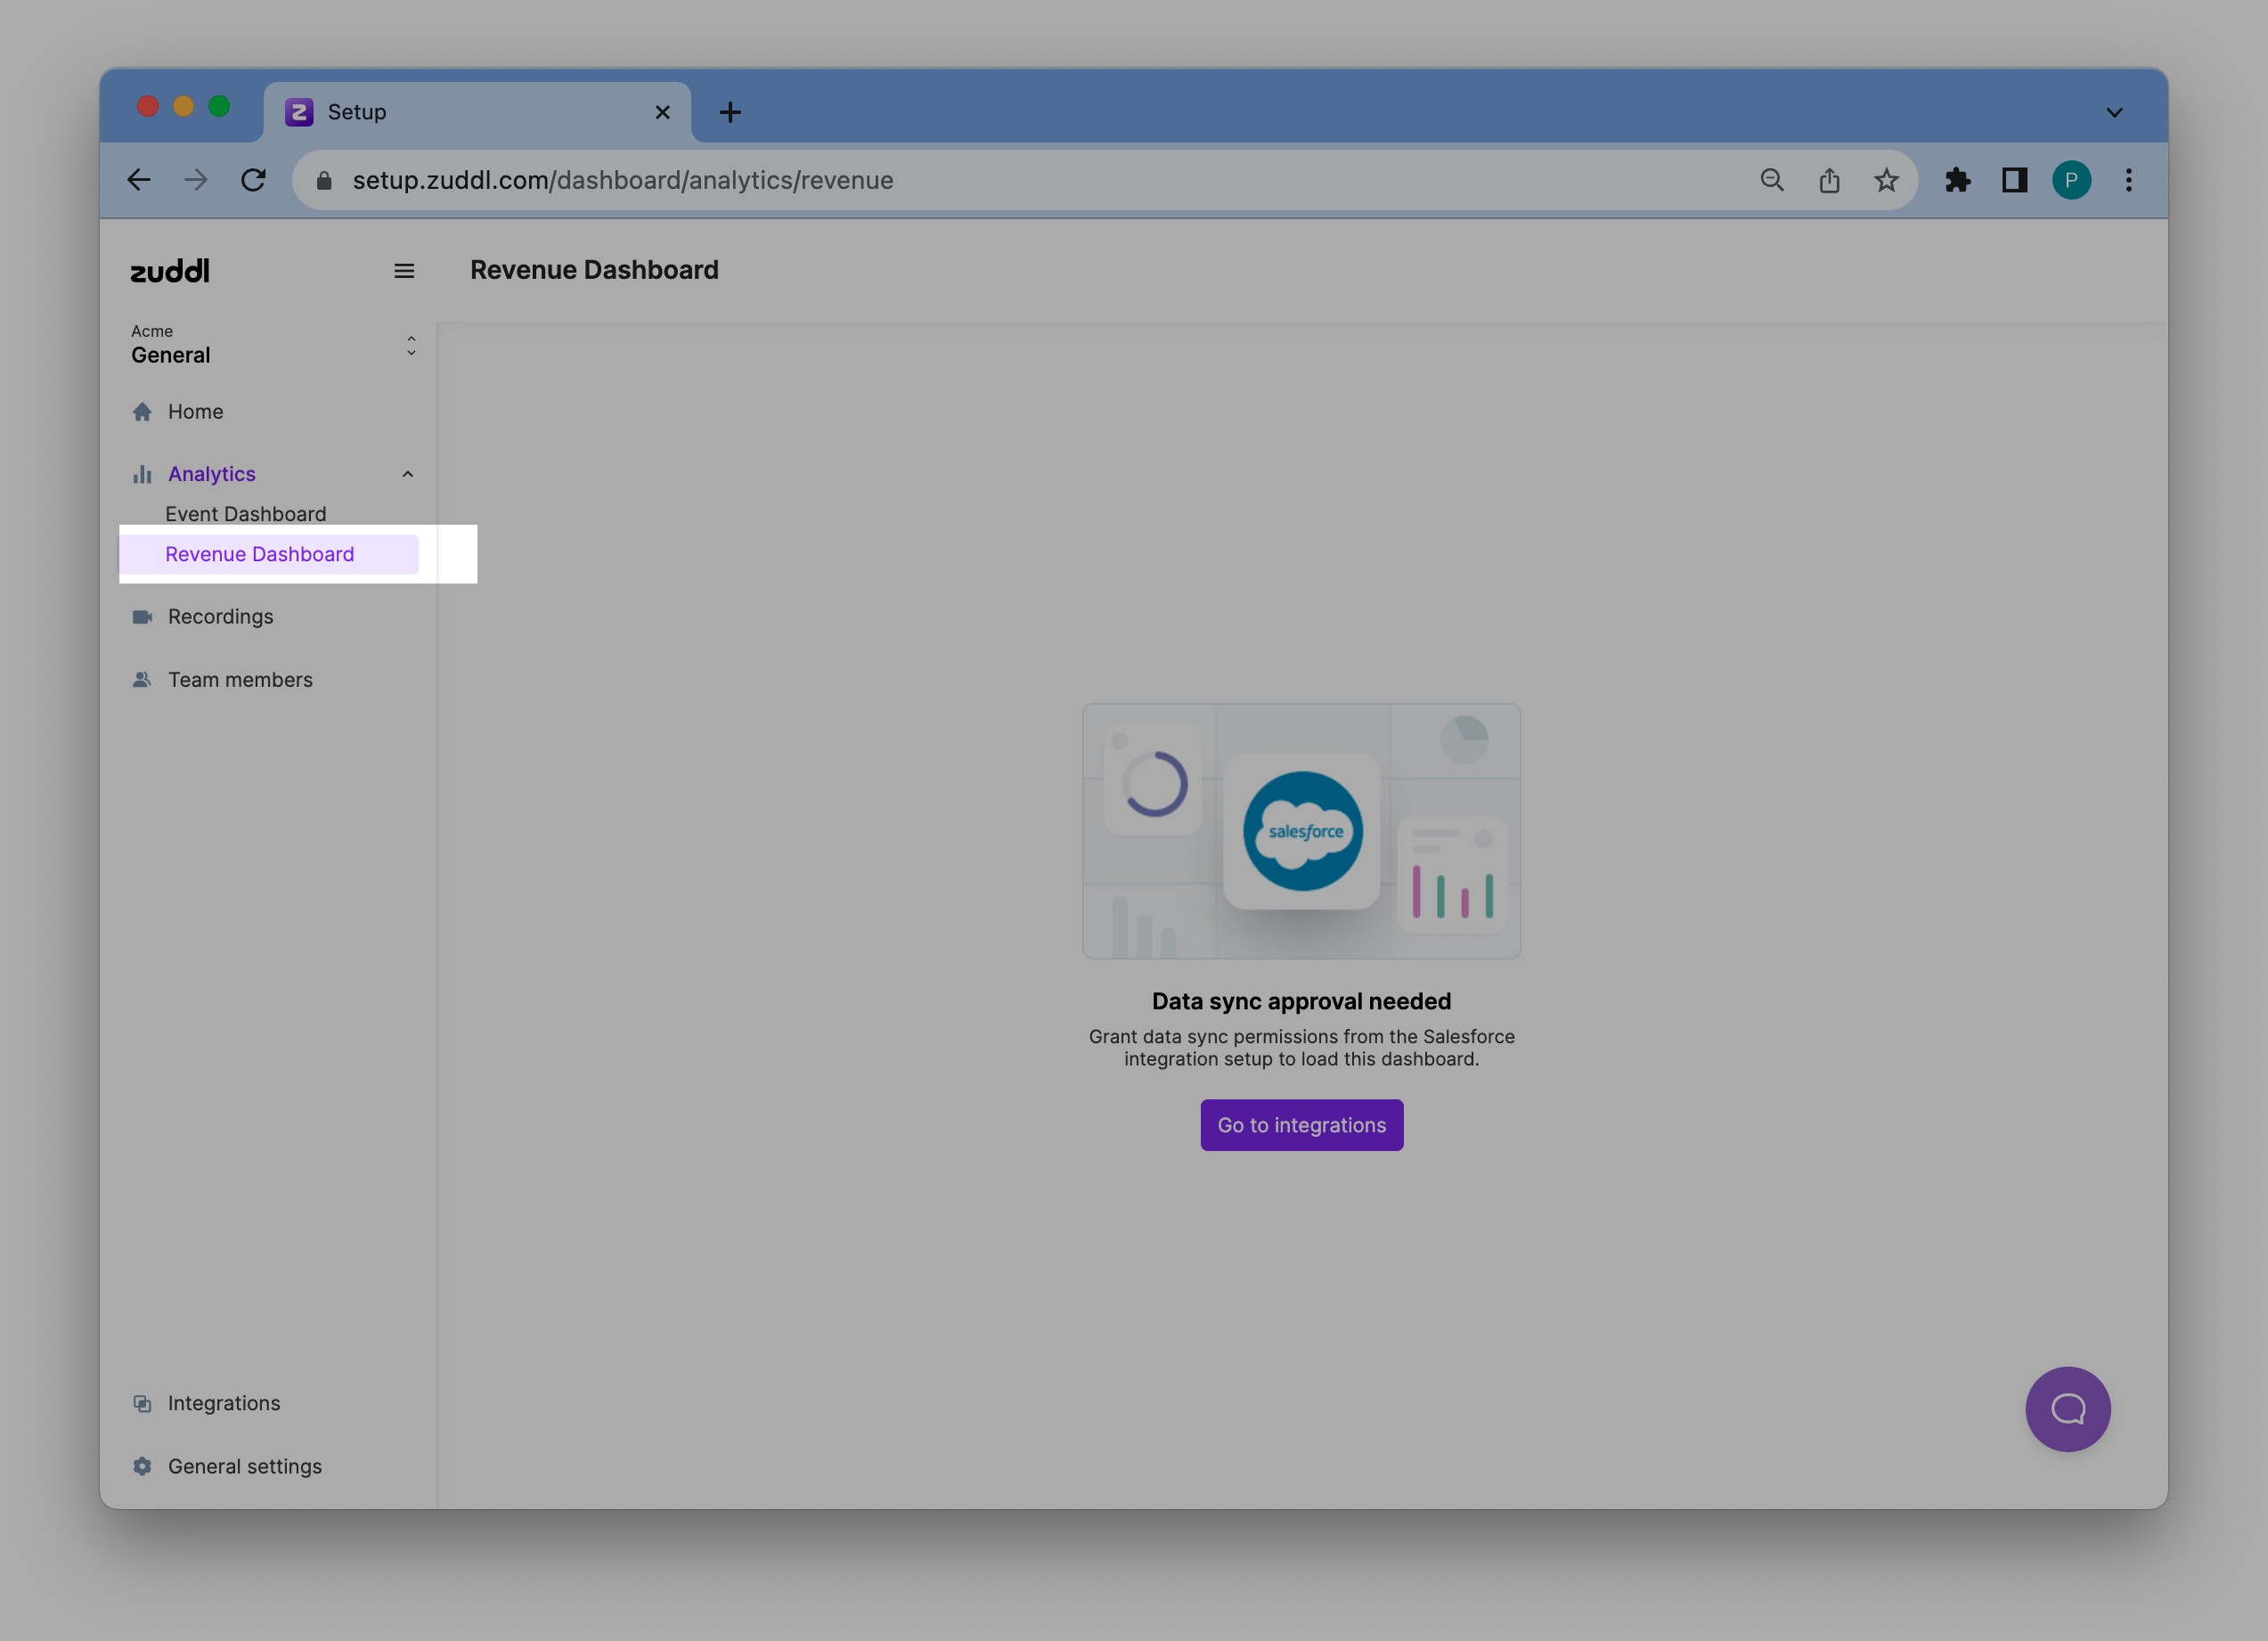
Click the Go to integrations button as the feature requires certain permission grant from the integration setup.
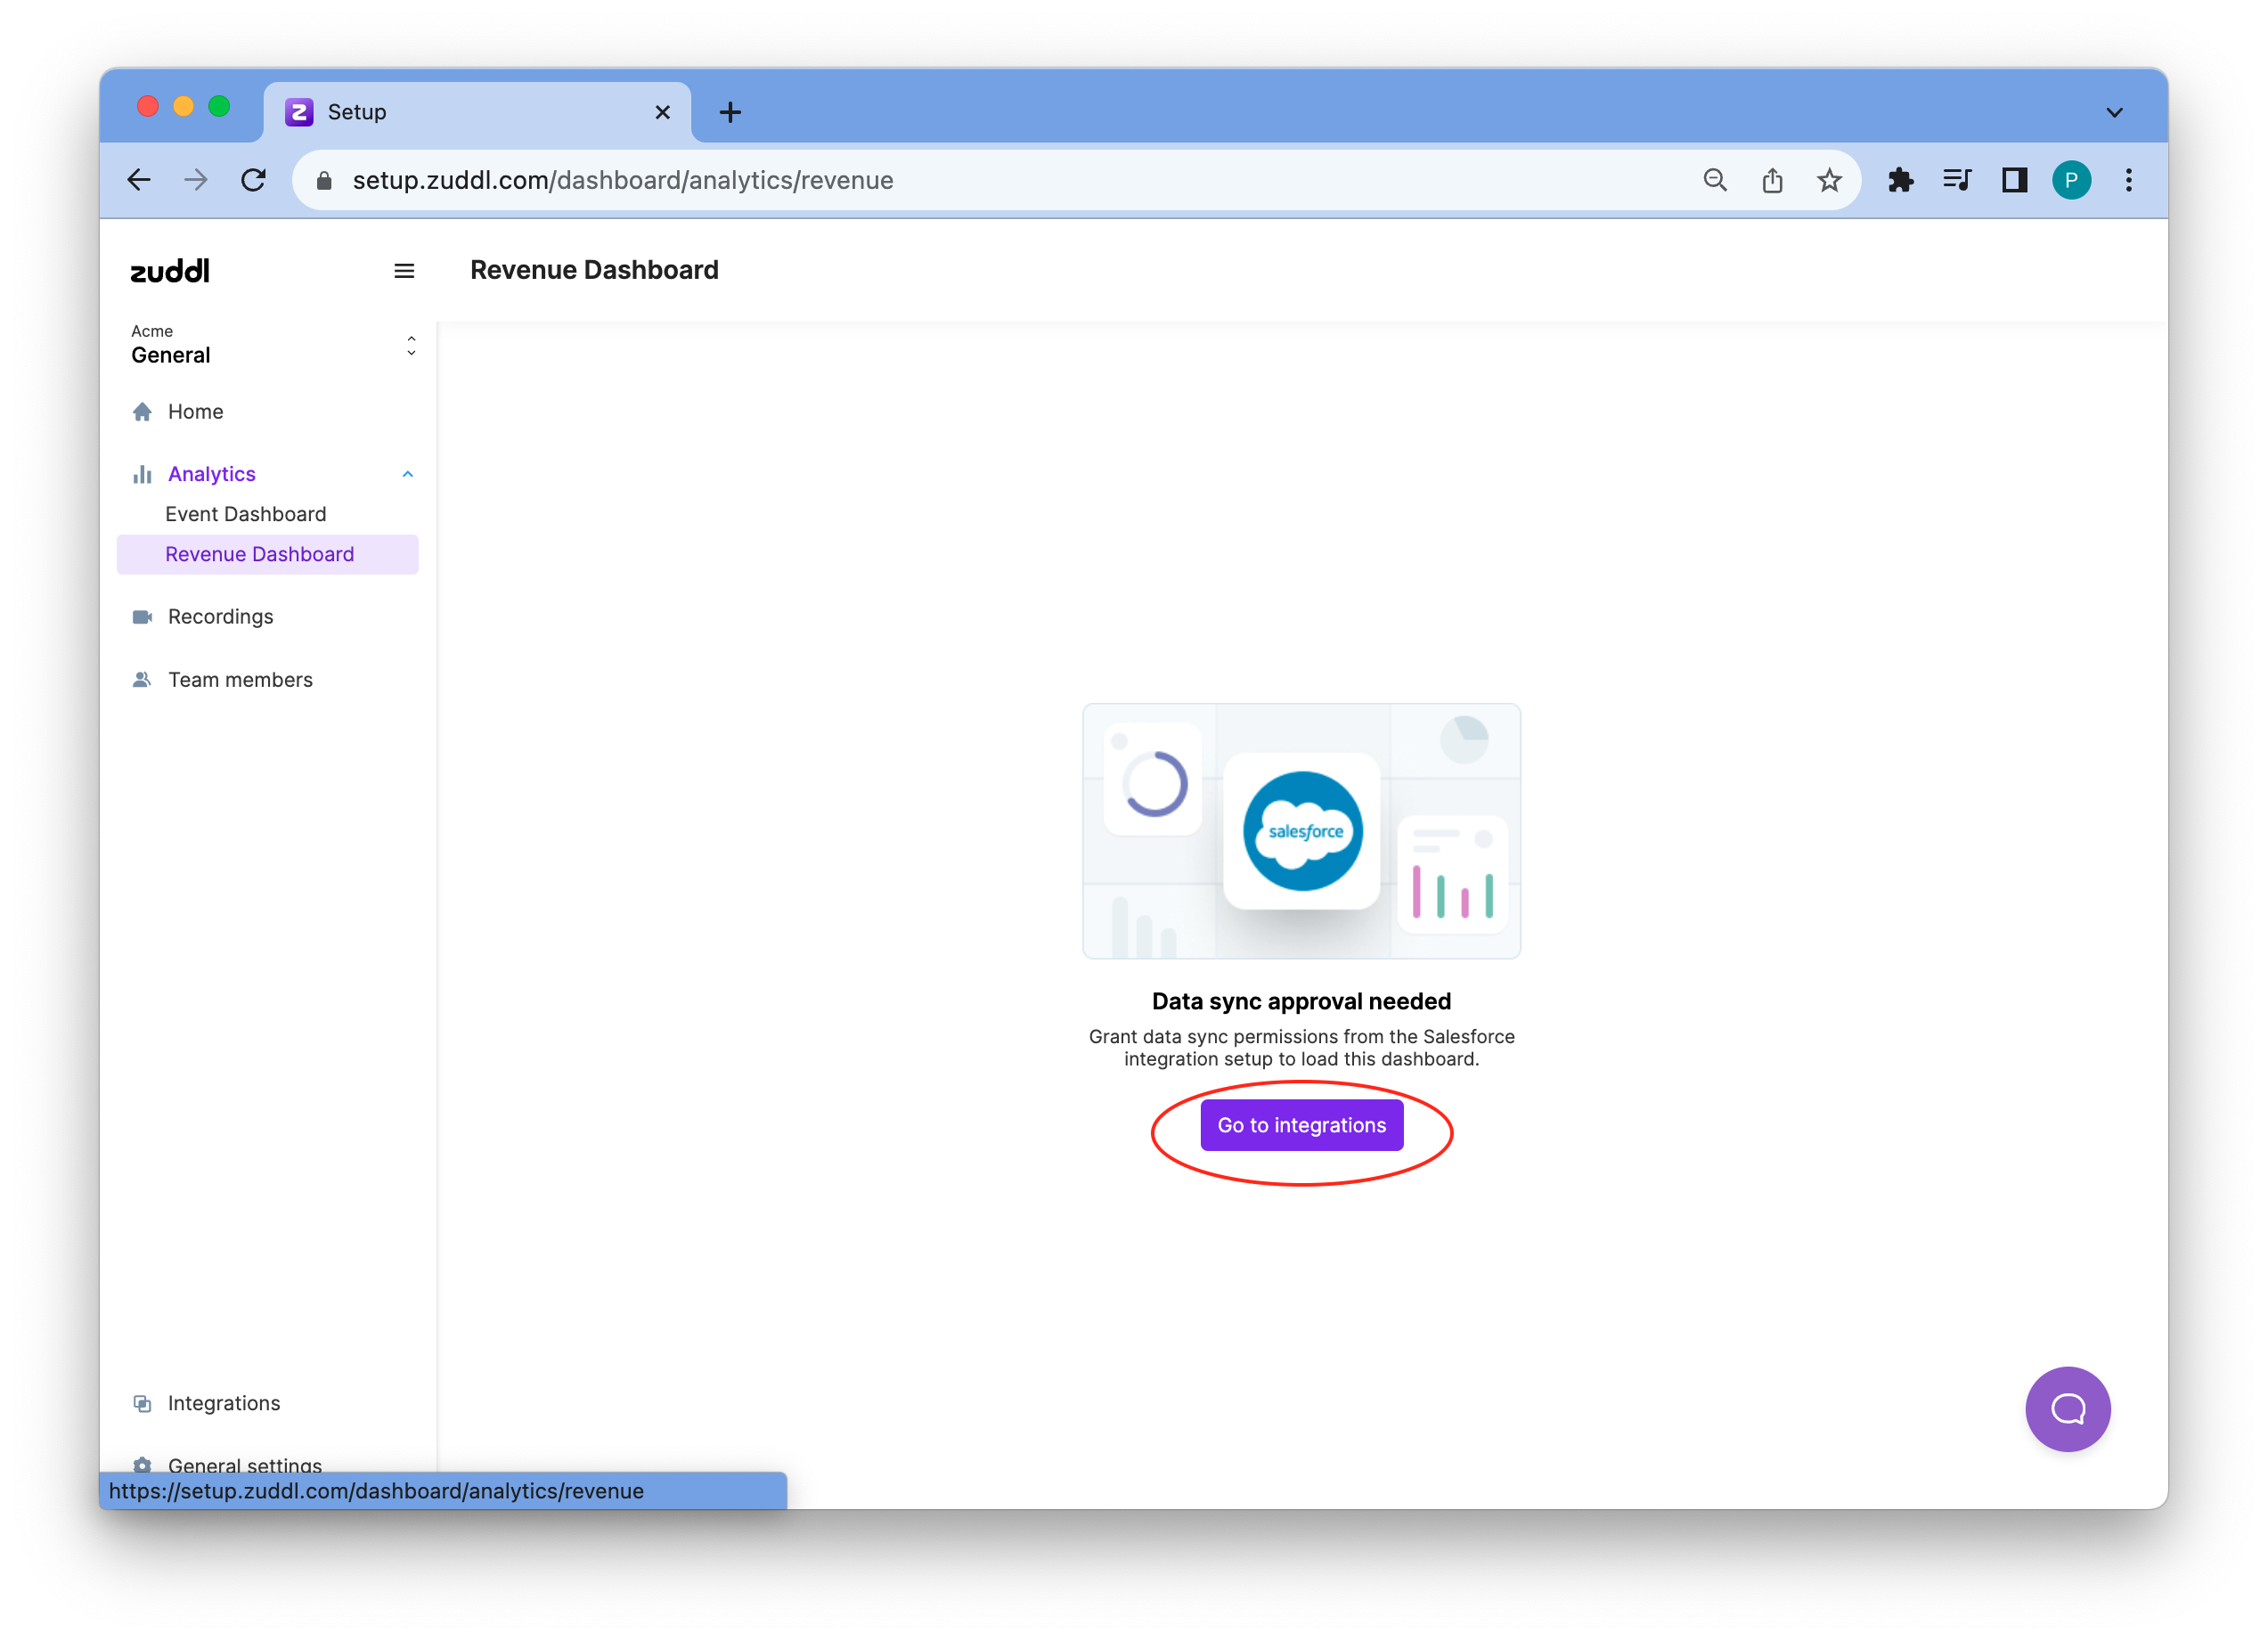
This redirects you to the Integration listing page
On the Salesforce integration card, click View details and then click the Edit button to edit the integration settings
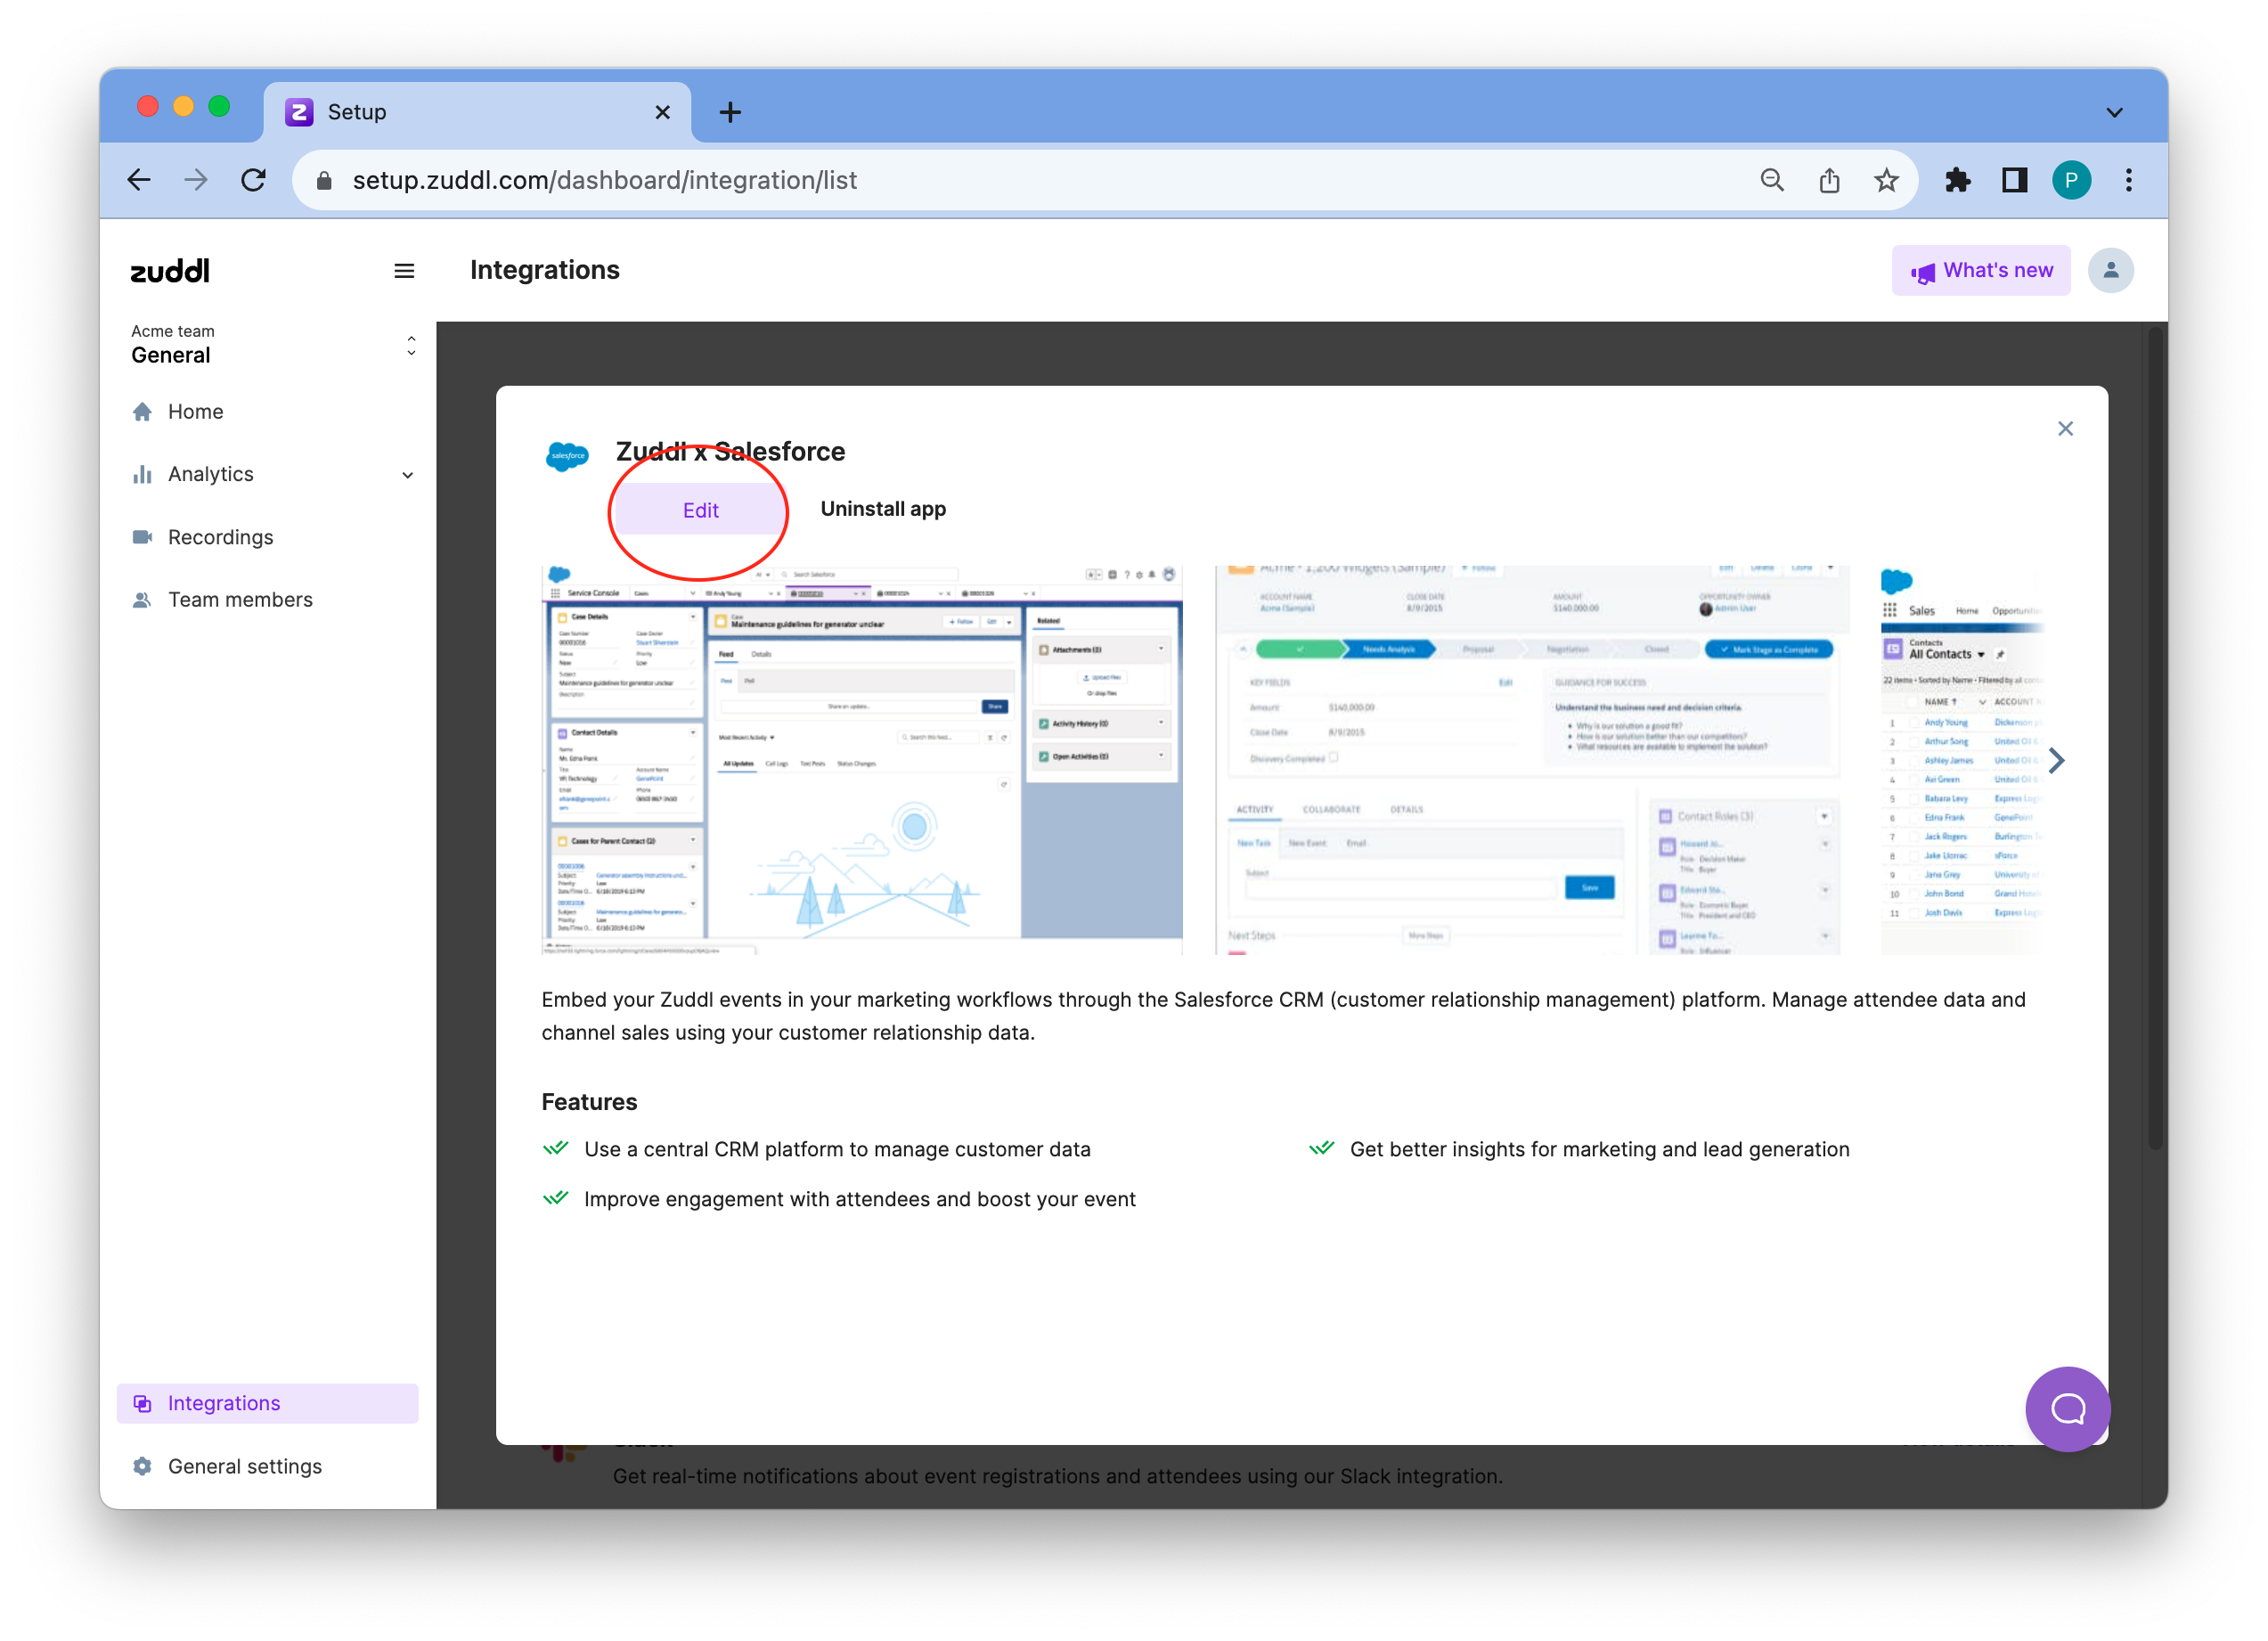
Select the Allow syncing Salesforce data for Zuddl’s Revenue Dashboard checkbox.

Then, click Finish. This provides the required data sync permission from the Salesforce integration to fetch data for the revenue dashboard.
Now, go back to the revenue dashboard and click the Sync now button, which starts to show when you grant permission. The sync takes around 30 minutes to fetch all the data, Zuddl sends an email notification once it's ready. This is a global sync and updates both event-level and org-level data.
Note: Data is not automatically synced to the dashboard but has to be manually synced. The dashboard allows you to perform a manual sync job every 1 hour.
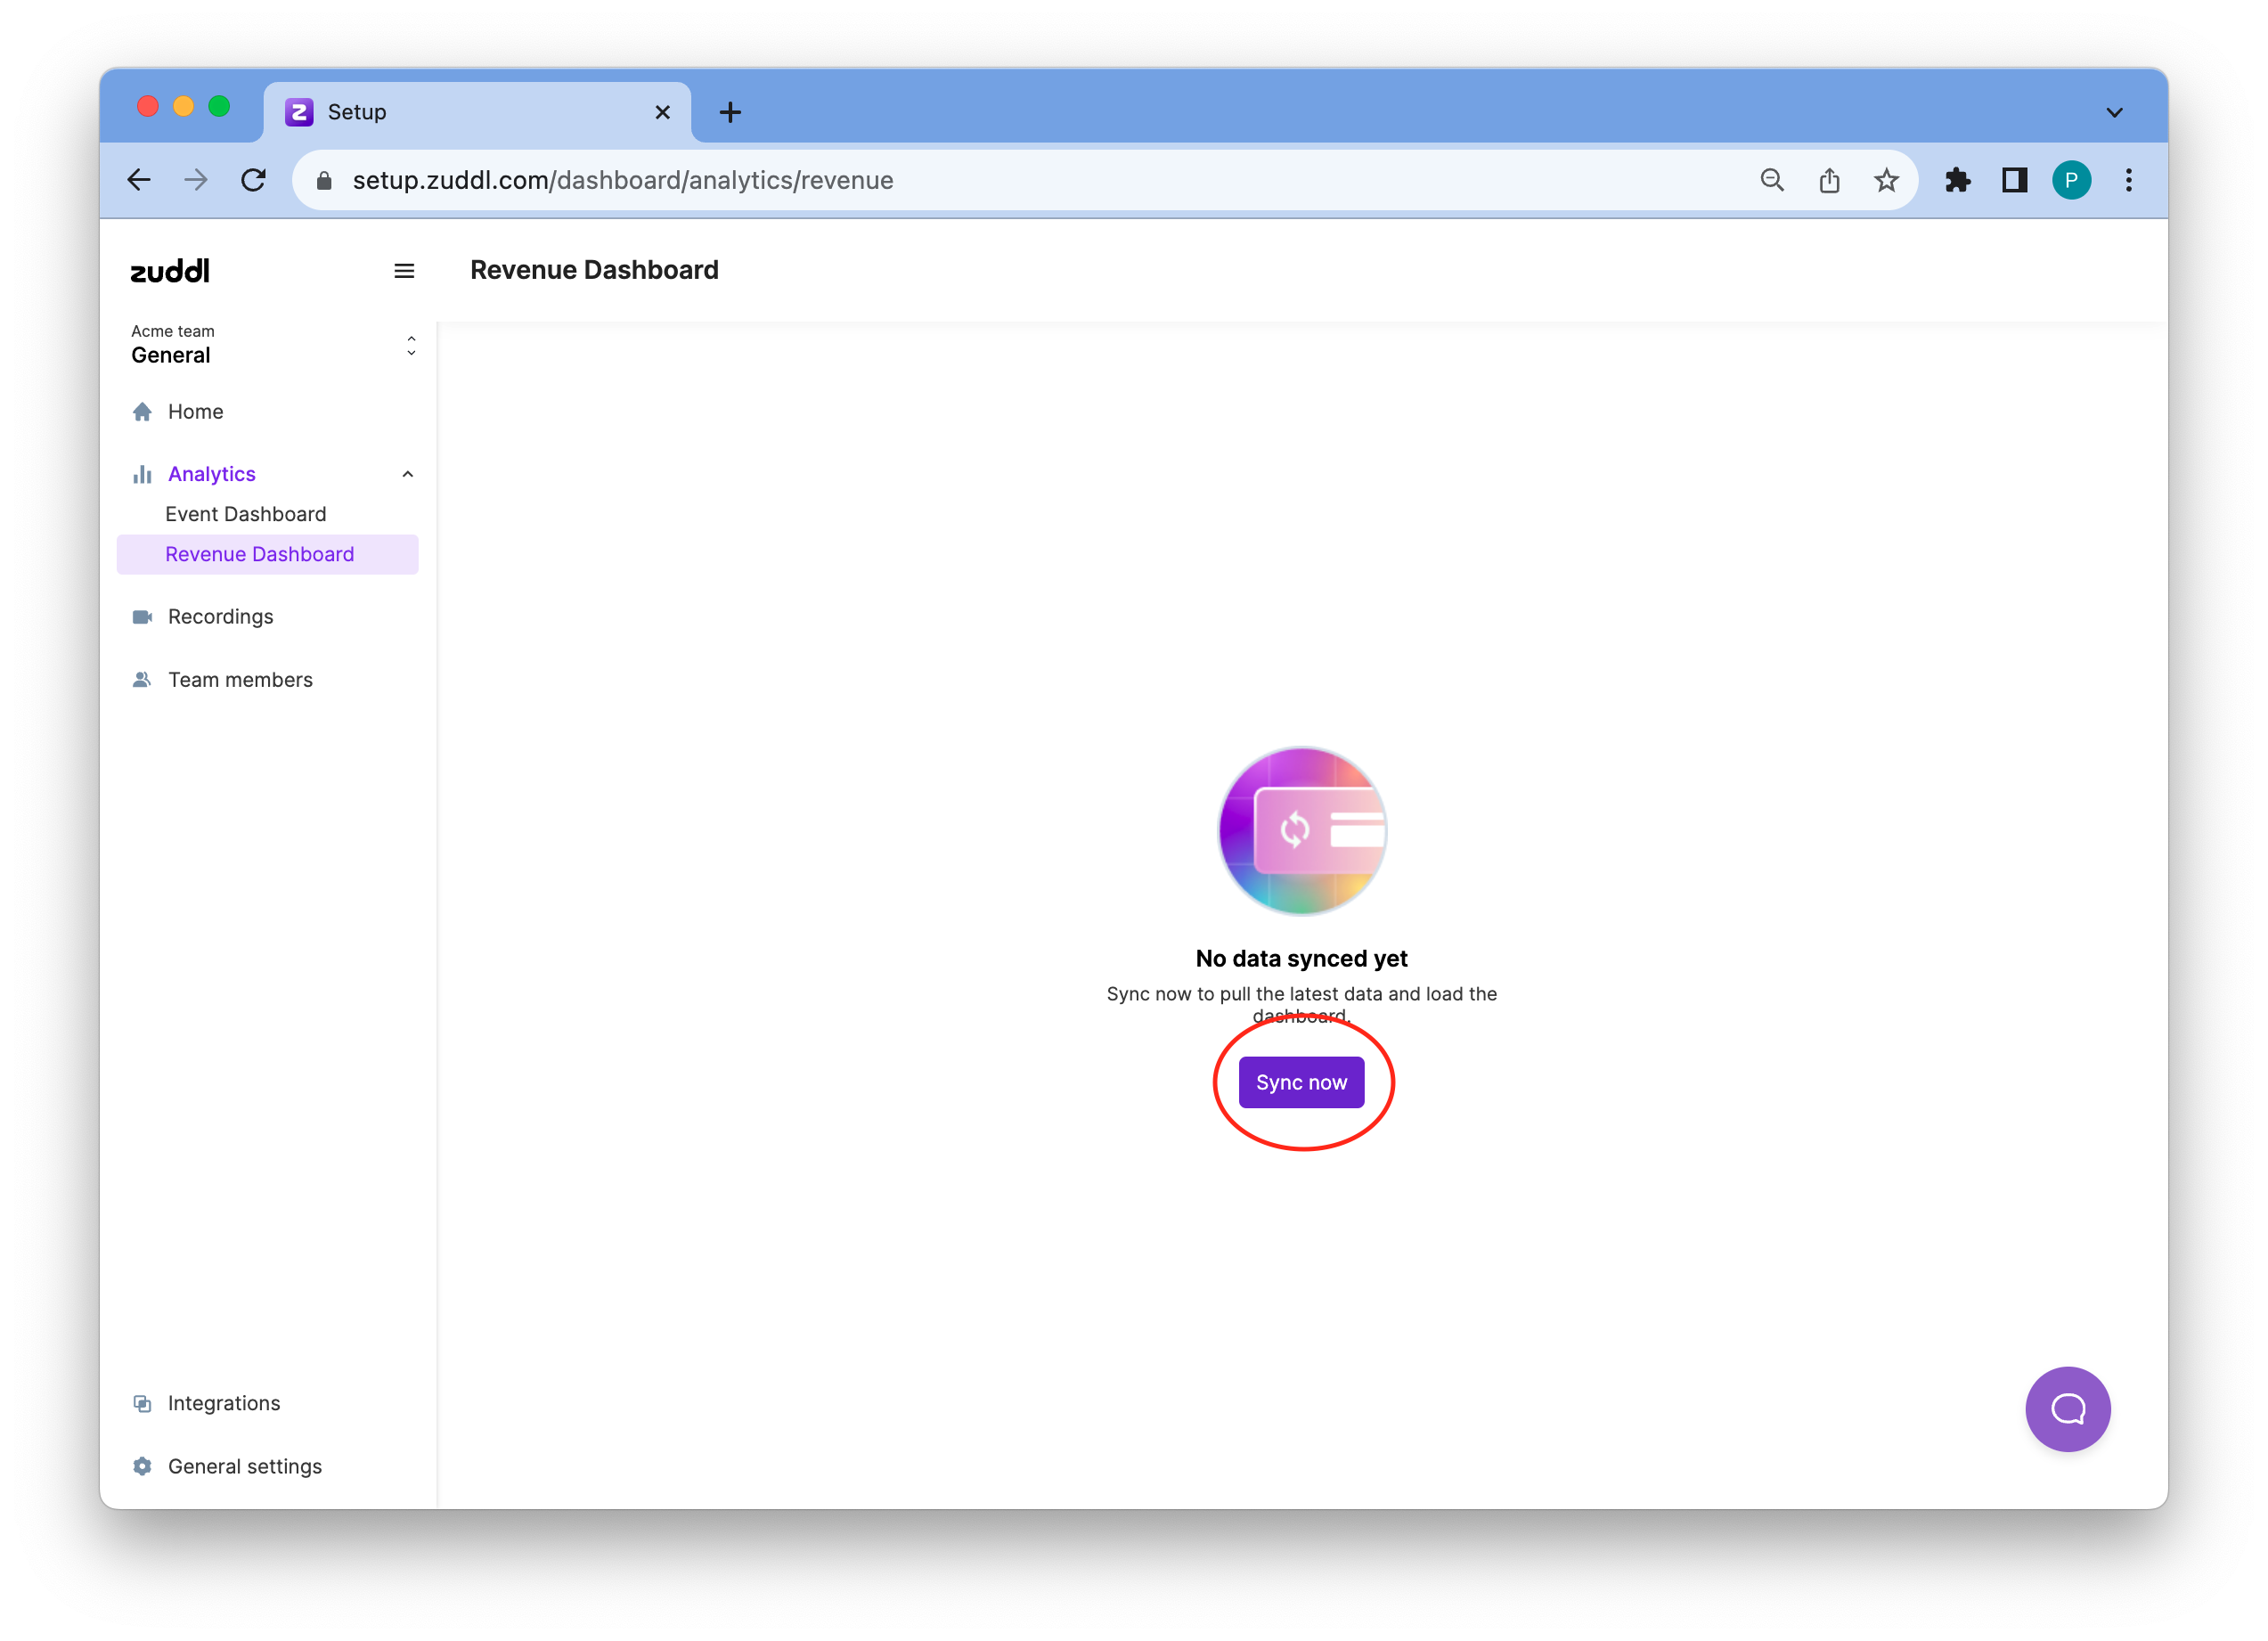
Reload the page after a few minutes to view the dashboard.
How to use the org-level revenue dashboard
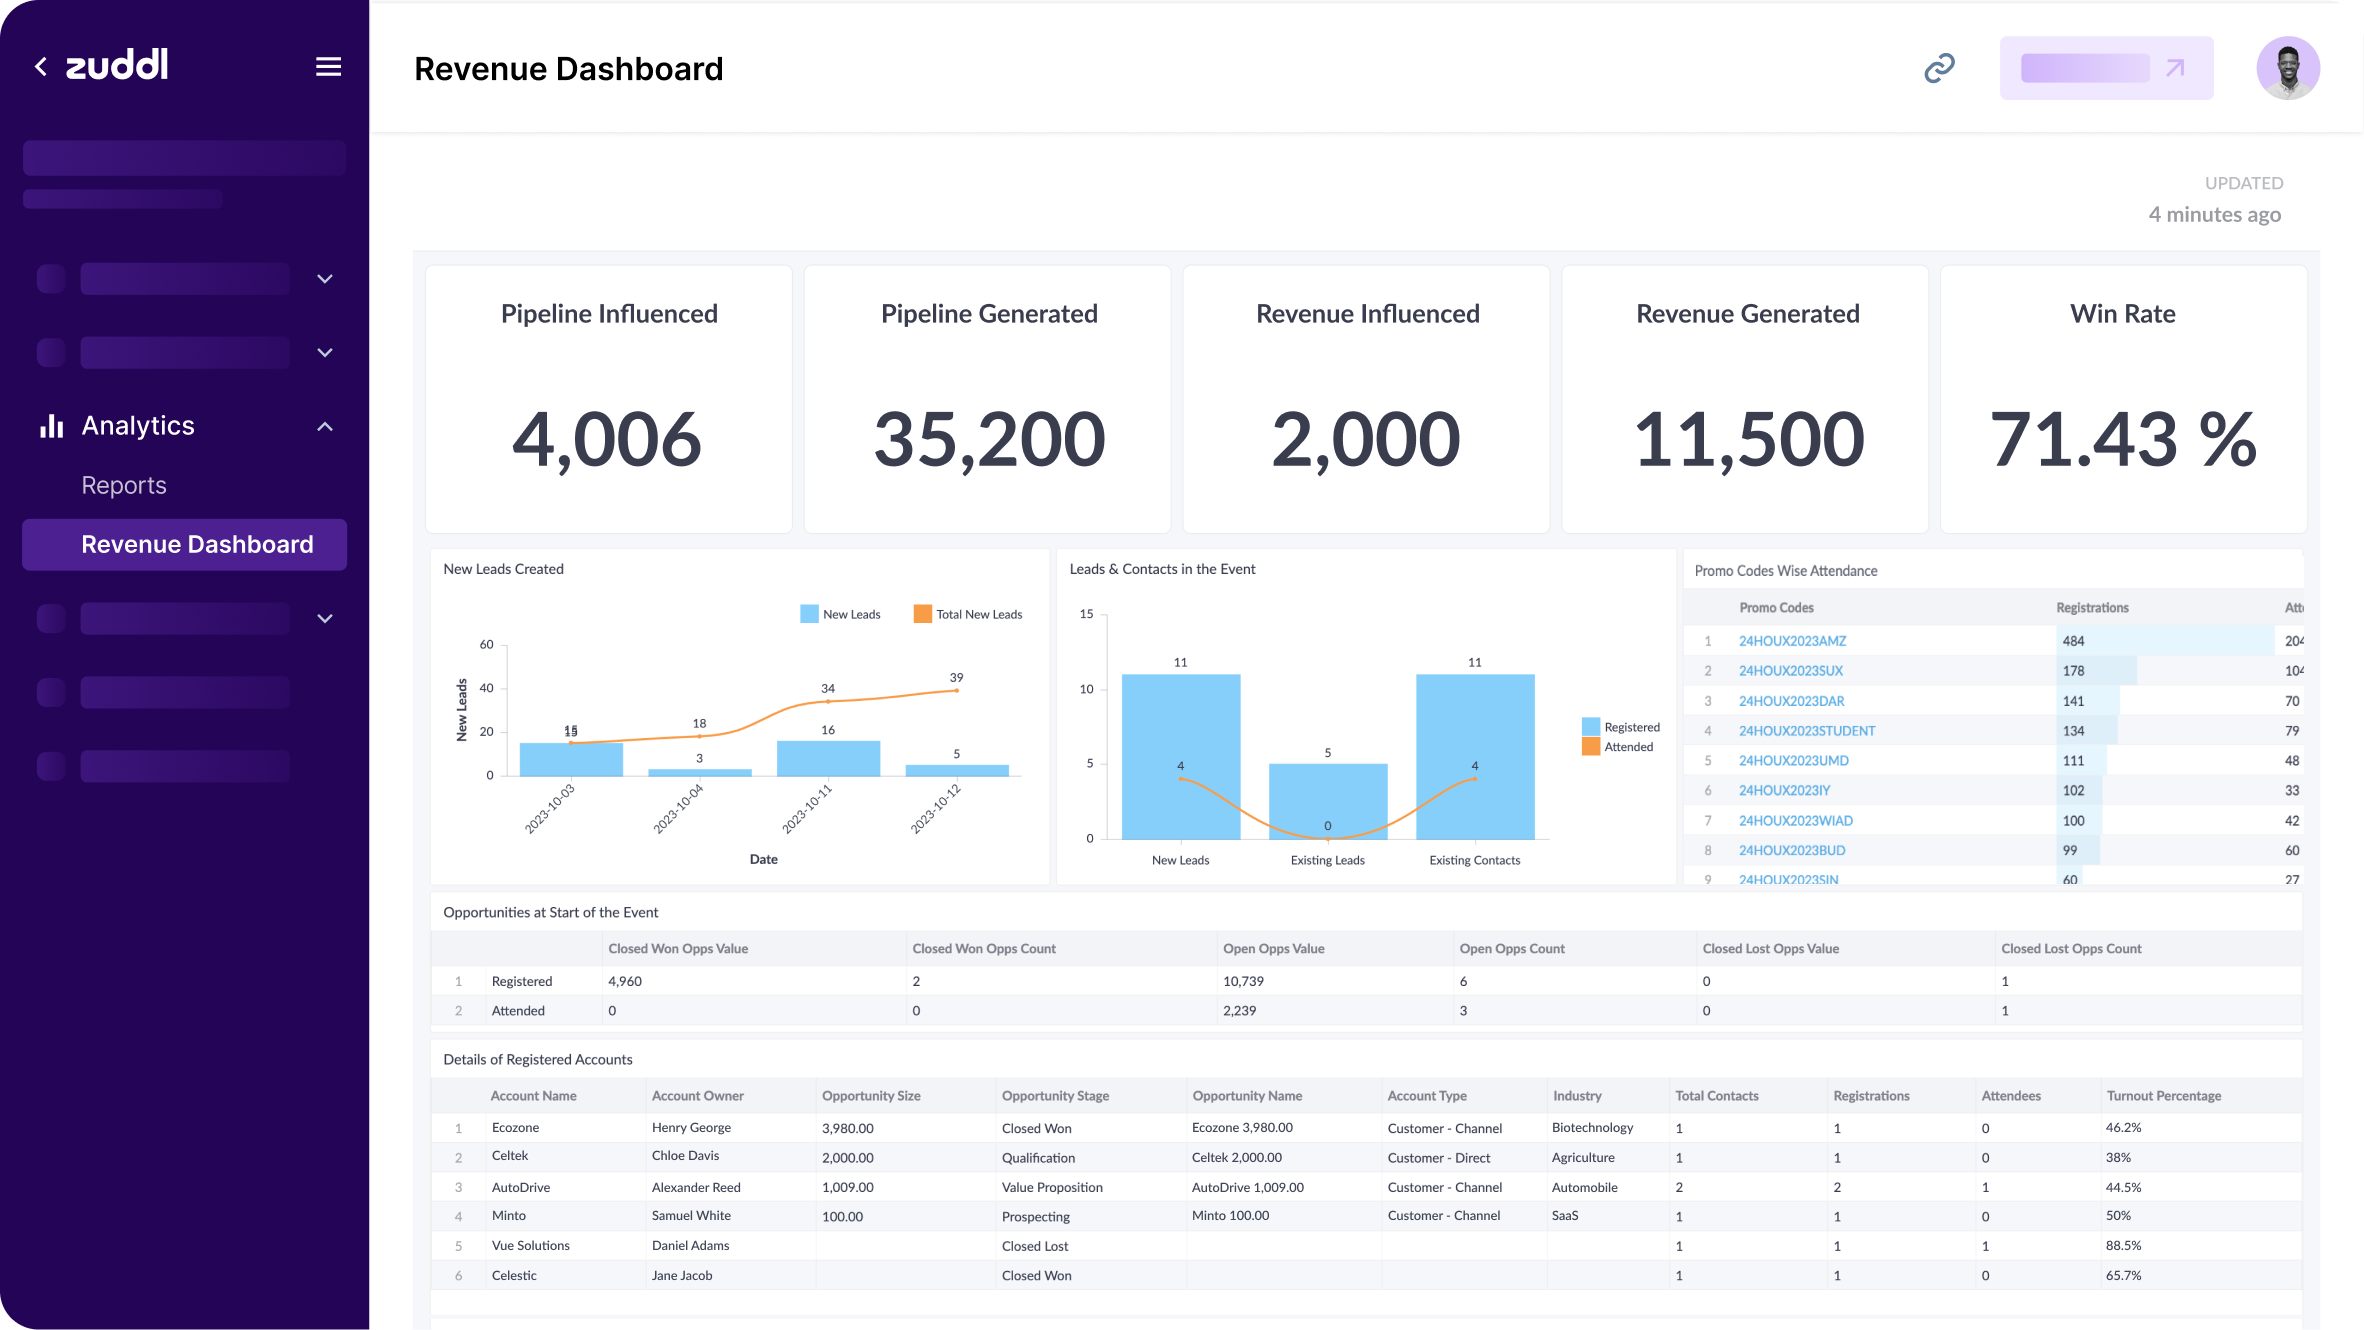
The org-level revenue dashboard shows all metrics that pertain to your entire organization in Zuddl (i.e, across event types: virtual events, webinars, in-person events & hybrid events). Before you start to slice and dice the data, you must specify the date & time range for fetching the data. You can use the three settings on top to use the same.
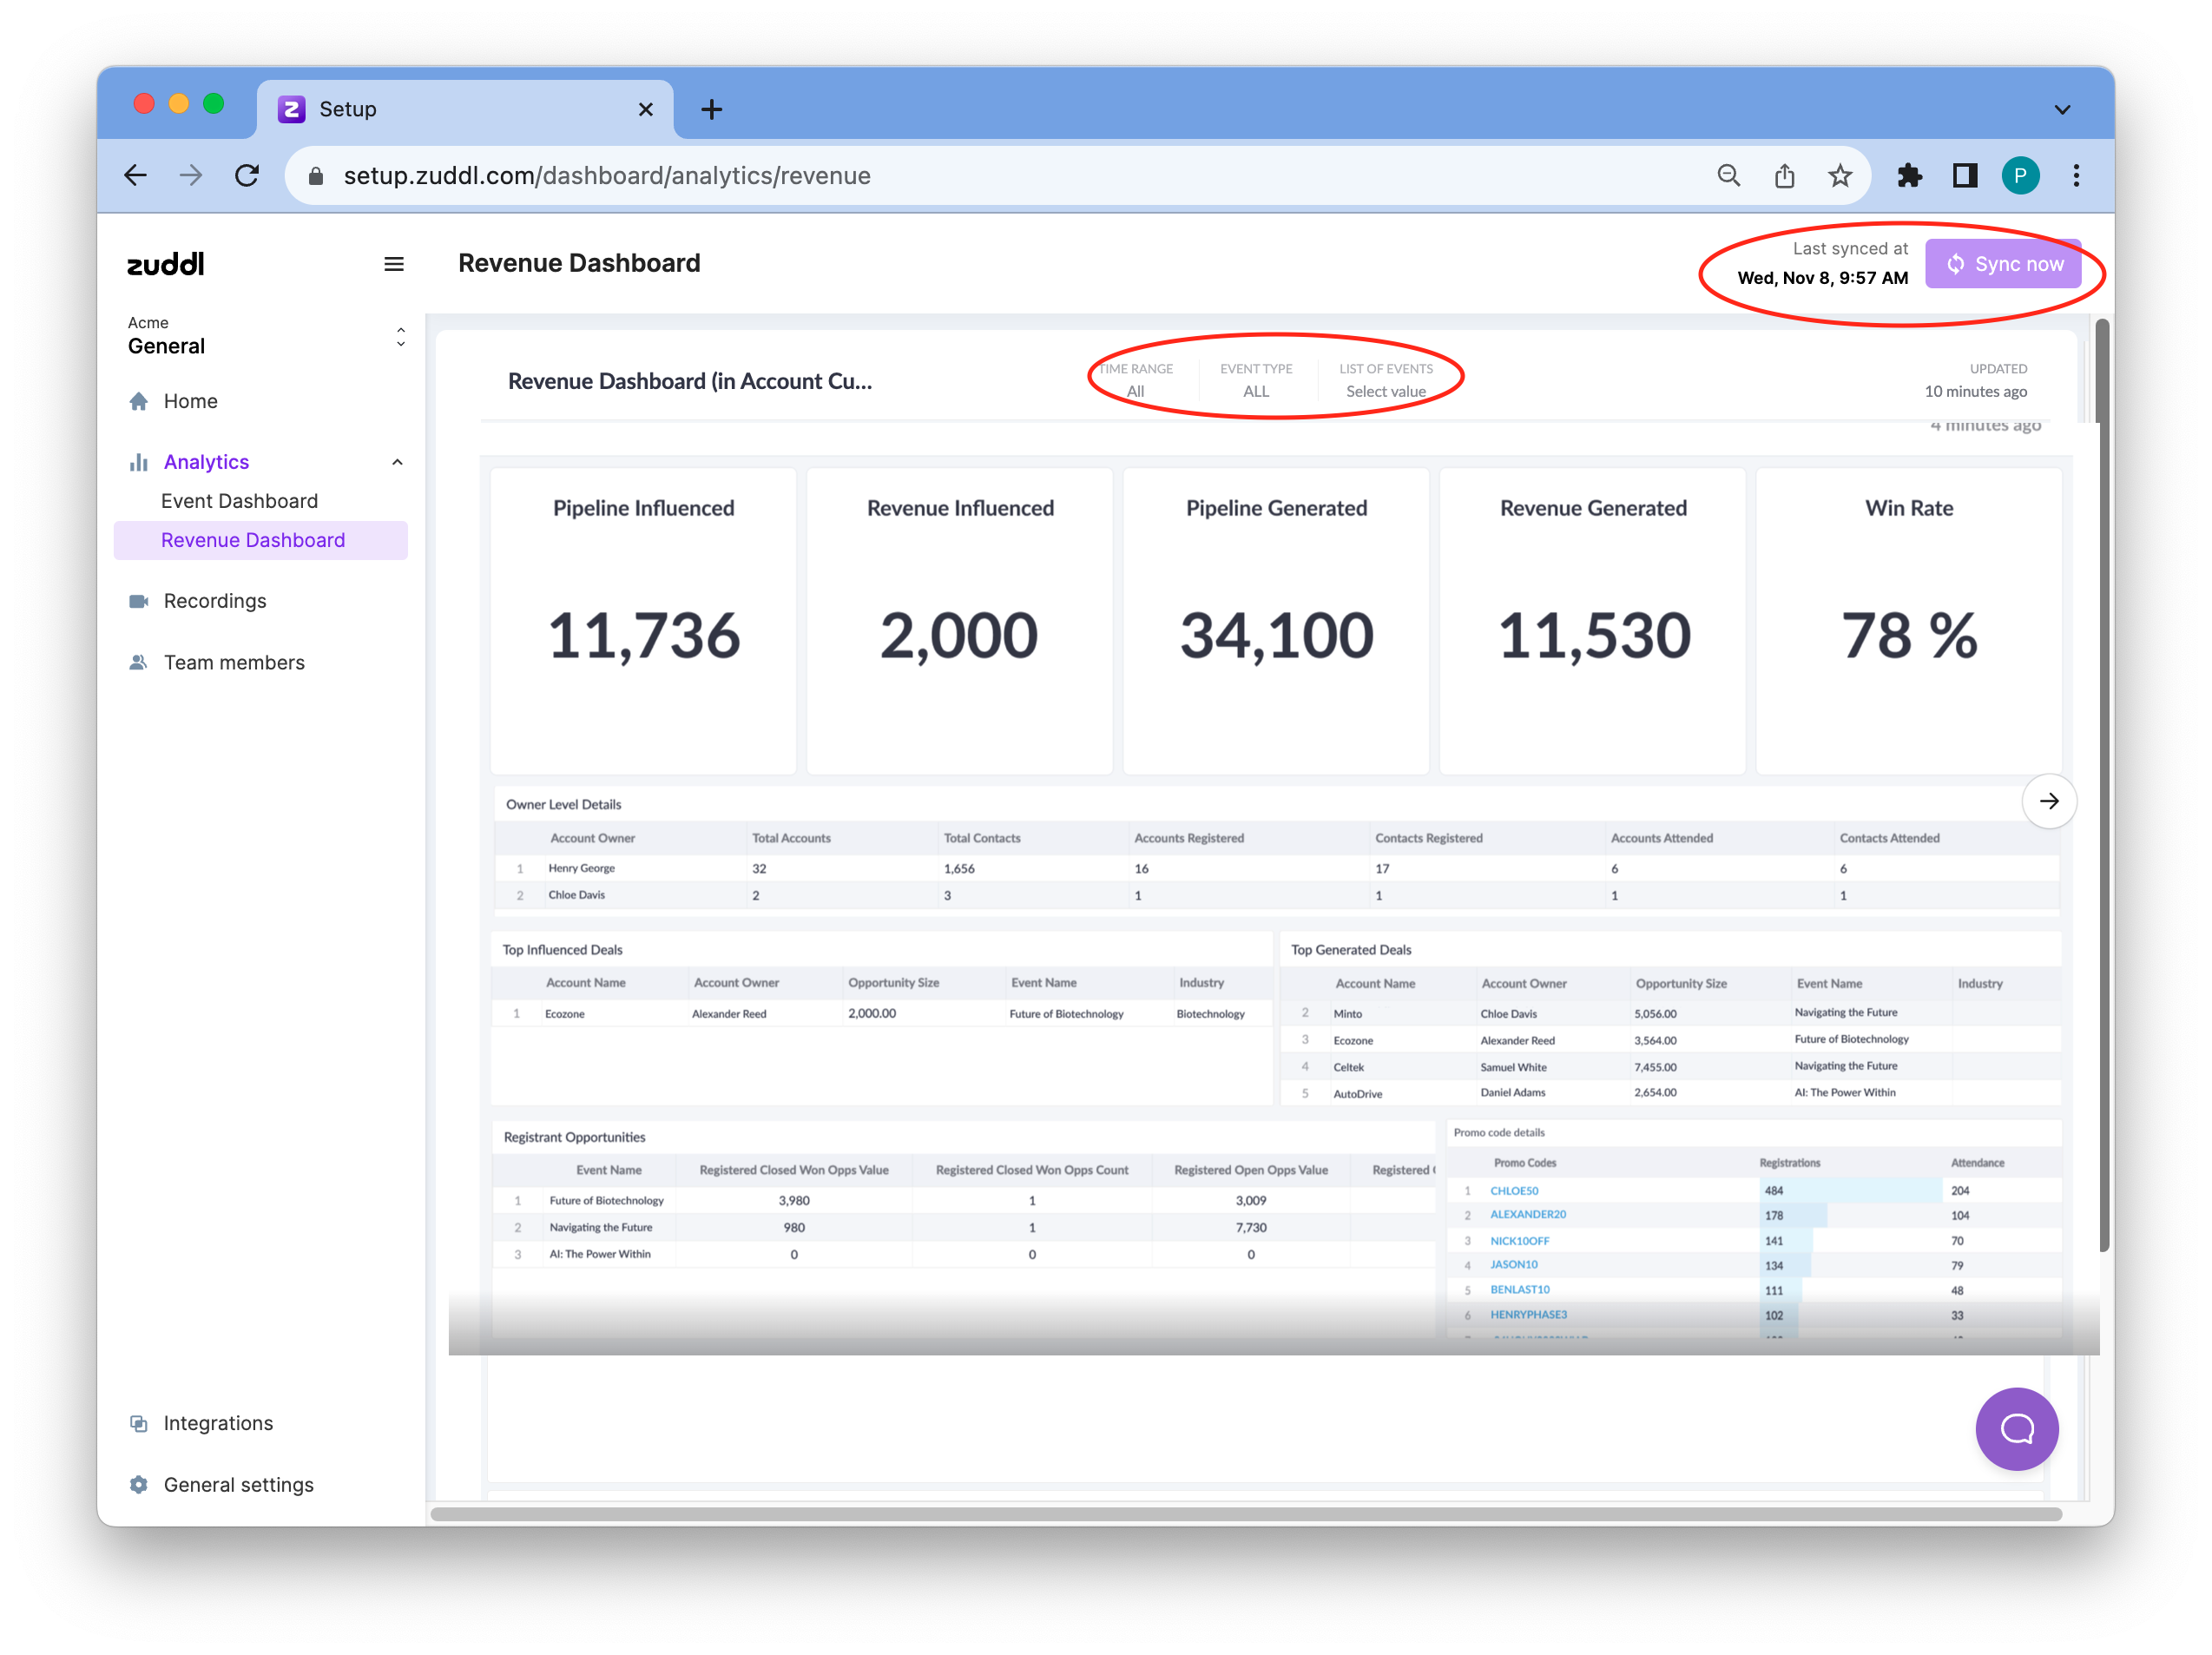
Set a specific Time Range using the date picker. Defaults to All.
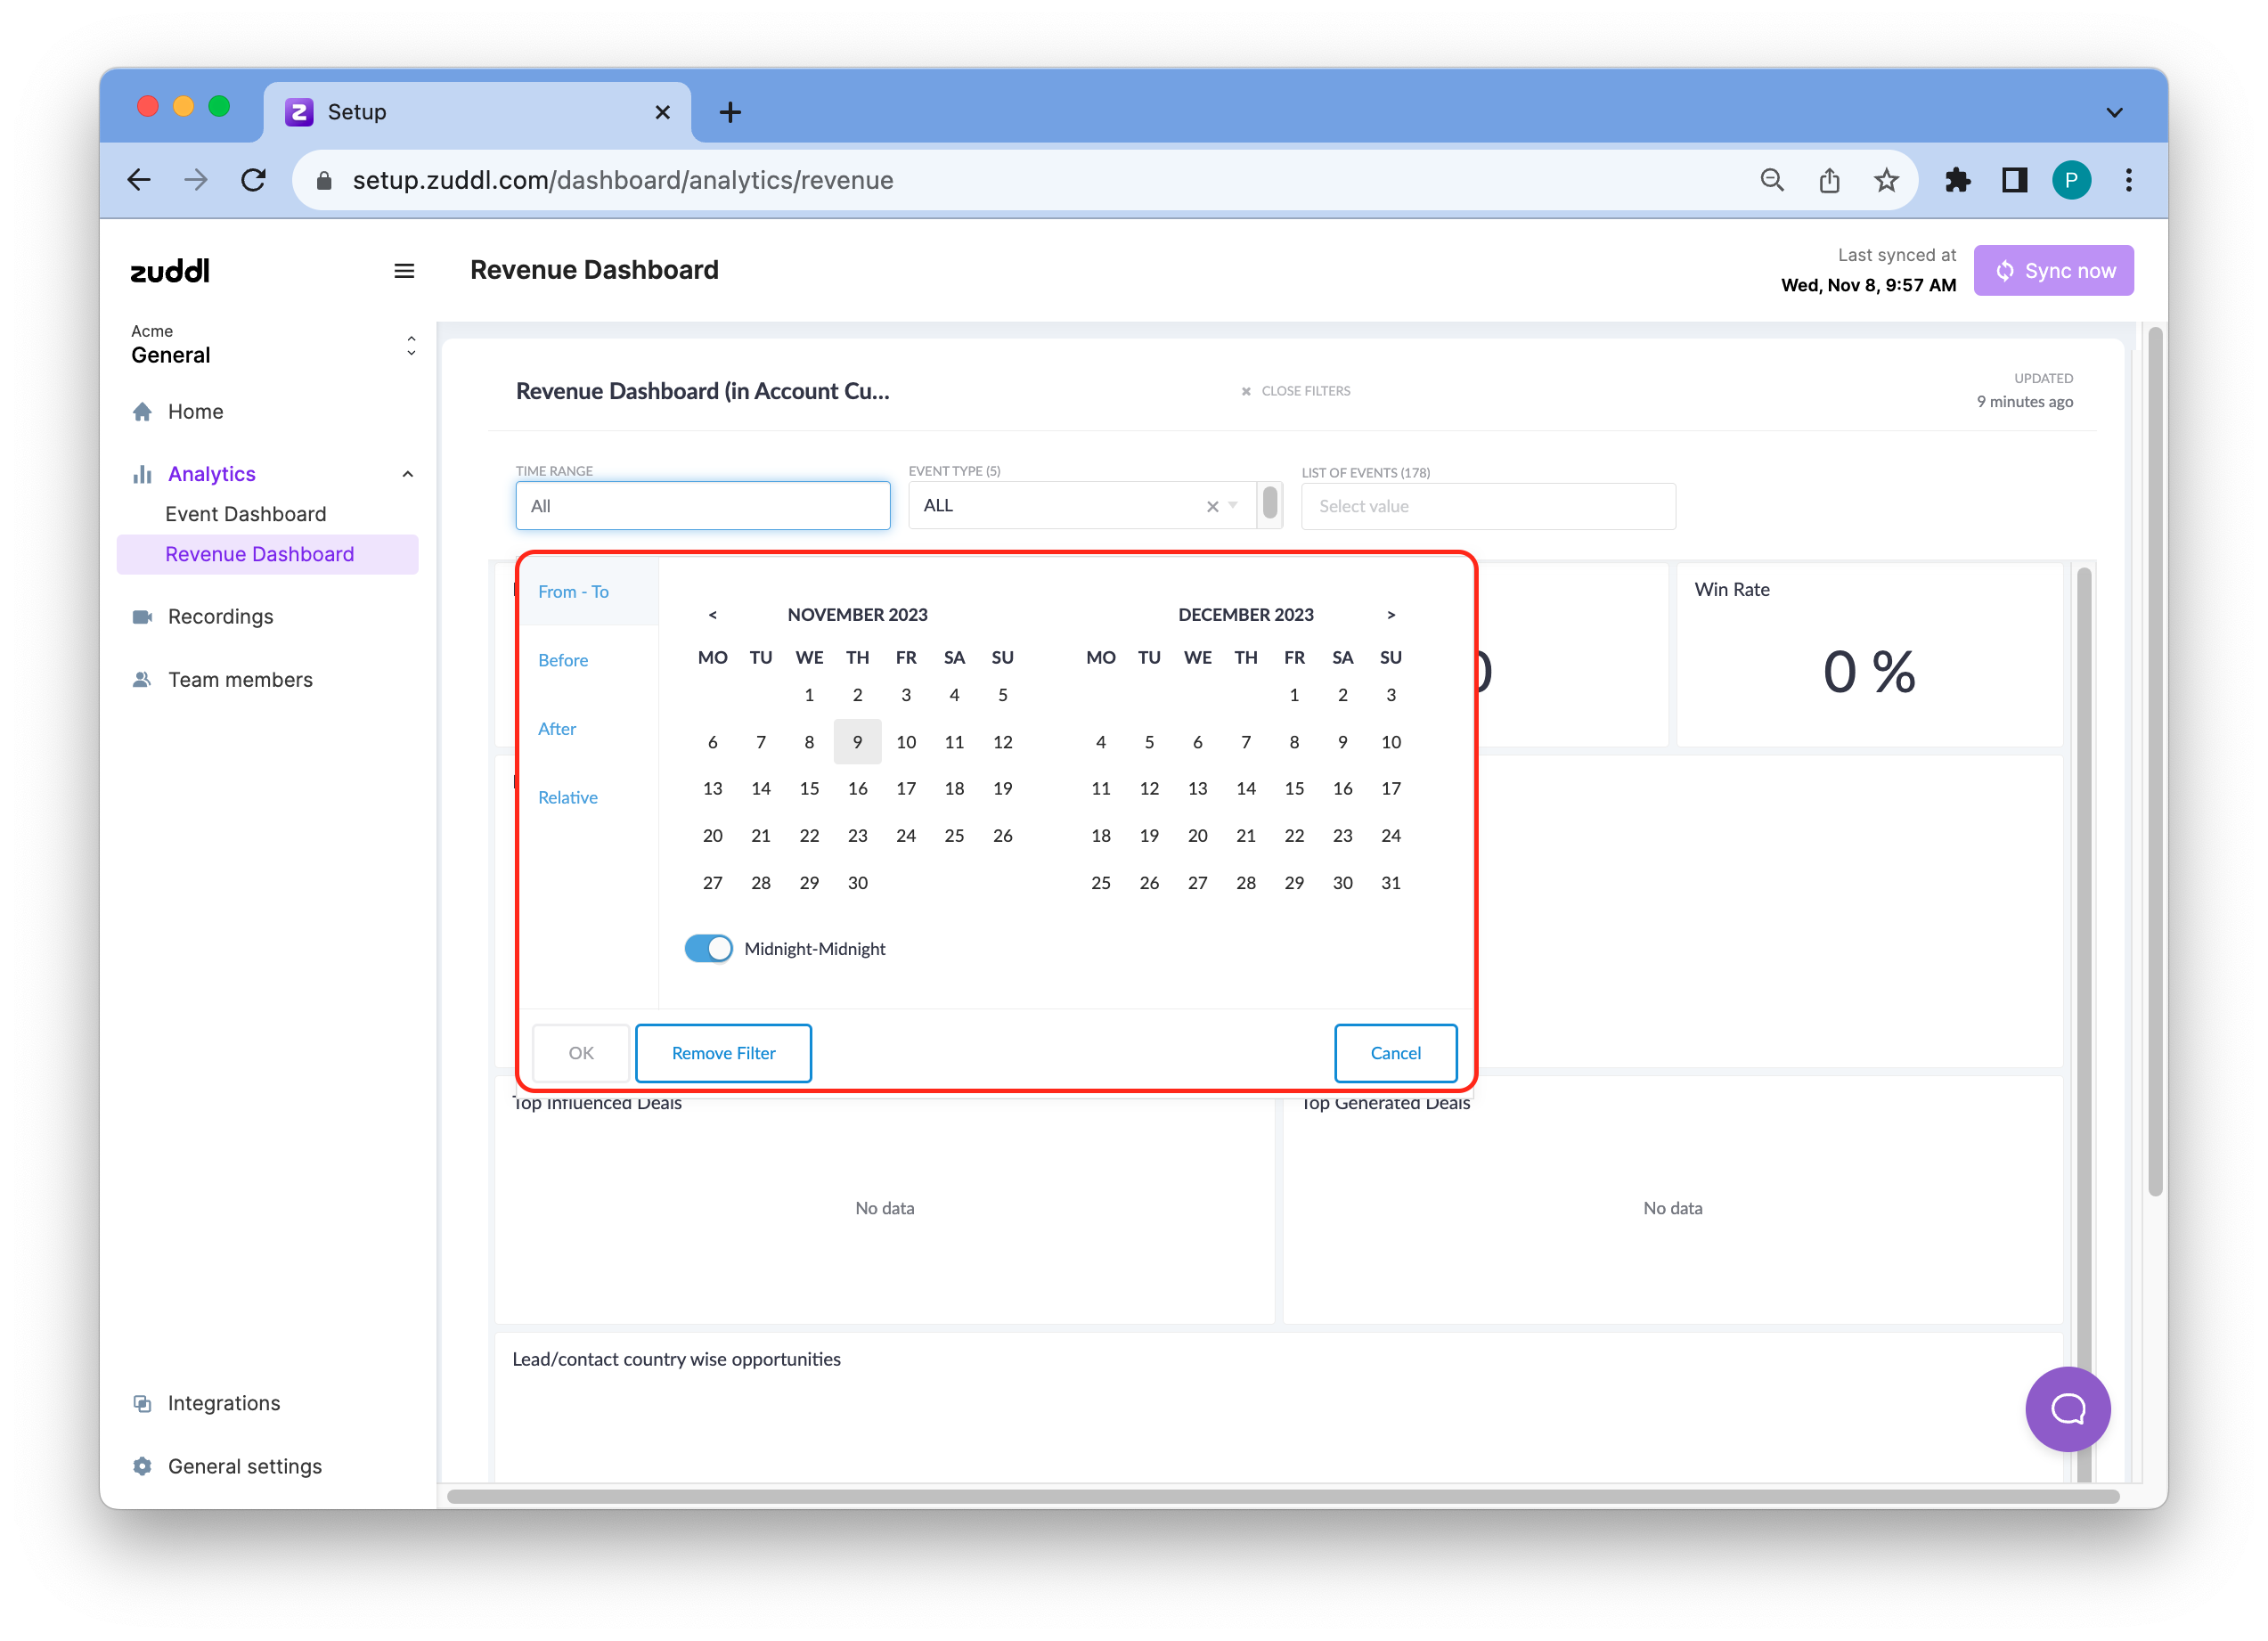
2. You can add four types of date filers
From-To: use this to select the date range for which you want to view the data. For the set date, either use the default Midnight-Midnight toggle (i.e 12:00 AM From date to 11:59 PM To date) or toggle off Midnight-Midnight to specify the exact From and To time.
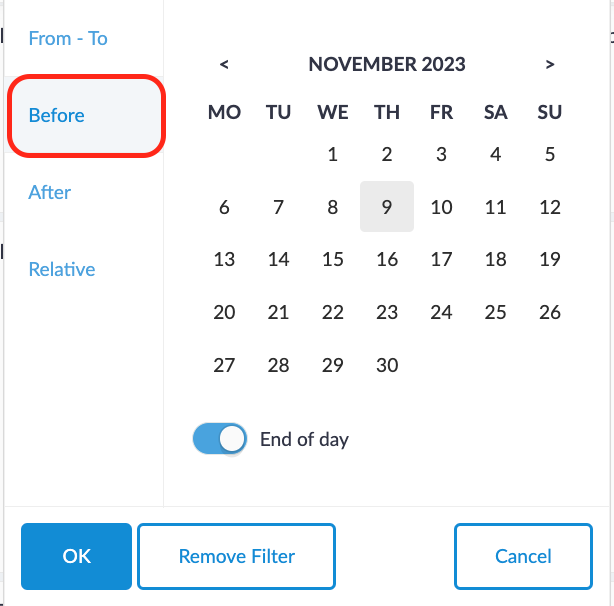
Before: Select a ‘To’ date to view all data before that date. Toggle the End of day to fetch data till the end of the current date.
After: Select a ‘From’ date to view all data after that date. Toggle the End of day to fetch data till the end of the current date.
Relative: Select a date & time range based on a specific logic. Choose the appropriate dropdown: Last, Last (ending now), This, This (ending now), and Previous. Choose the appropriate number of seconds, minutes, hours, days, weeks, months, quarters,
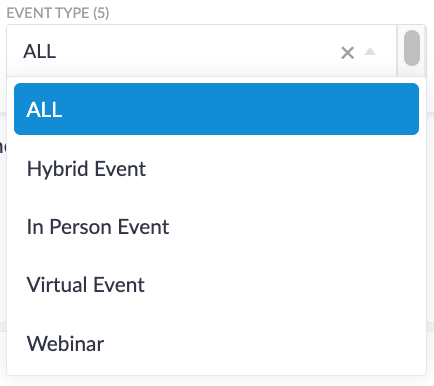
Select the event type: virtual events, webinars, in-person events & hybrid events. Defaults to All.
Choose a specific event from the List of events dropdown. The dropdown shows past and ongoing events event names.
How to read the dashboard
The dashboard only shows opportunities that were influenced by Zuddl.
The table below explains the meaning of each metric using which you can get relevant insight for your business.
Name | Description | Time frame |
Pipeline Influenced | The total value of new opportunities created in customer accounts and the latest new opportunities created in prospect accounts who attended the event. | Within 90 days after the event start date |
Pipeline Generated | The total value of opportunities created in accounts (new or existing) who attended the event. This includes:
| Within 90 days after the event start date |
Revenue Influenced | Total value of the influenced pipeline opportunities that were closed won. | |
Revenue Generated | Total value of the generated pipeline opportunities that were closed won. | |
Win Rate (W) | Closed Won Opportunities after the event (Cw) / All Closed Opps after the event (C op) from attendee accounts (Cw)/(C op)*100 = W |
Registrant Opportunities
Opportunities that registered for an event and were moved to closed won stage
Registered | Attended | |
Closed Won Opps Value | The total value of the opportunities in customer accounts that have registered for your event. | The total value of the opportunities in customer accounts that have attended the event. |
Closed Won Opps Count | The total count of customer accounts that have registered for your event. | The total count of customer accounts that have attended the event. |
Open Opps Value | The total value of the opportunities in prospect accounts that have registered for your event. | The total value of the opportunities in prospect accounts that have attended the event. |
Open Opps Count | The total count of prospect accounts that have registered for your event. | The total count of prospect accounts that have attended the event. |
Closed Lost Opps Value | The total value of lost opportunities that have registered for your event. | The total value of lost opportunities that have attended for your event. |
Closed Lost Opps Count | The total count of prospect accounts that have registered for your event. | The total count of prospect accounts that have attended the event. |
Top Influenced Deals
Event influenced pipeline opportunities with the highest deal size (deal amount) in descending order. Along with the following info: Account name, Account owner, Opportunity Size, Event Name, and Industry.
Top Generated Deals
Event generated pipeline opportunities with the highest deal size (deal amount) in descending order. Along with the following info:, Account name, Account owner, Event name, and Industry
Country/Account Wise Sales Status
The sales amount shown based on countries or account type
Name | Description |
Opportunity Influenced Count | The total number of event-influenced pipeline opportunities for a particular country or account type |
Opportunity Influenced Value (OPi) | The total value of all event-influenced pipeline opportunities for a particular country or account type |
Revenue Influenced Value (Ri) | The total value of all event-influenced pipeline opportunities in the closed won stage for a particular country or account type |
Win Rate Influenced (Wi) | Revenue Influenced Value / Opportunity Influenced Value. Ri/OPi=Wi |
Opportunity Generated Count | The total number of event-sourced opportunities for a particular country or account type |
Opportunity Generated Value (OPg) | The total value of all event-sourced opportunities for a particular country or account type |
Revenue Generated Value (Rg) | The total value of all event-sourced opportunities in the closed won stage for a particular country or account type |
Win Rate Generated (Wg) | Total Revenue Generated Value / Total Opportunity Generated Value. Rg/OPg=Wg |
Event-level Dashboard
To view the event-level revenue dashboard
Login to your dashboard.
Go to the event setup for the desired event
Under Analytics, click the Revenue Dashboard.
How to read the dashboard
The dashboard mainly uses CRM terminologies, mostly specific to Salesforce. So, if you are familiar with the Salesforce terminology, you can quickly learn how to read the revenue dashboard.
The first section of the dashboard shows the same cards as in the org-level. Refer to the how to read the org-level revenue dashboard section.
Graphs
Name | Description |
New leads created | A bar graph that shows day-on-day new leads and total new leads created by Zuddl |
Leads and contacts in the Event | A bar graph that shows new or existing leads and existing contacts who have registered for the event. This graph also shows who attended the event via a line chart. |
Coupon-wise registration and attendance | Registrations and attendance at the event are based on individual coupon codes created for the event. |
Opportunities at the Start of the Event
Opportunities that registered/ attended an event and were moved to the closed won stage at the start of the event. This table only shows details for a particular event.
Registered | Attended | |
Closed Won Opps Value | The total value of the opportunities in customer accounts that have registered for your event. | The total value of the opportunities in customer accounts that have attended the event. |
Closed Won Opps Count | The total count of customer accounts that have registered for your event. | The total count of customer accounts that have attended the event. |
Open Opps Value | The total value of the opportunities in prospect accounts that have registered for your event. | The total value of the opportunities in prospect accounts that have attended the event. |
Open Opps Count | The total count of prospect accounts that have registered for your event. | The total count of prospect accounts that have attended the event. |
Closed Lost Opps Value | The total value of lost opportunities that have registered for your event. | The total value of lost opportunities that have attended for your event. |
Closed Lost Opps Count | The total count of prospect accounts that have registered for your event. | The total count of prospect accounts that have attended the event. |
Details of Registered Account
Details of the SFDC accounts that have registrations.
Name | Description |
Account Name | Name of the Account in SFDC |
Account Owner | Name of the Account Owner in SFDC |
Account Type | Type of account in SFDC. For example, Customer - Direct, Customer - Channel |
Opportunity Size | The deal amount of the opportunity |
Opportunity Stage | The current stage of the opportunity. For example, “Prospecting”, “Qualification”, “Closed Won”, “Closed Lost” |
Opportunity Name | The opportunity name in SFDC |
Industry | Industry of Work of the attendee in Zuddl |
Total Contacts | Total number of contacts in the account in SFDC |
Registrations | Total number of registrations from the domain of this account. |
Attendees | Total number of registrants who attended the event |
Turnout Percentage | The percentage of total attendees out of total registrations |
Country Wise Registration & Attendance
This table shows the total number of Registered and Attended users based on countries with Turnout Percentage.
Name | Description |
Country | The country name |
Registered | The number of users who registered for your event |
Attended | The number of registrants who attended the event |
Turnout | The percentage of total attendees out of total registrations |
Title Wise Registration & Attendance
This table shows the total number of Registered and Attended users based on titles with Turnout Percentage.
NameDescription | |
Country | The country name |
Registered | The number of users who registered for your event |
Attended | The number of registrants who attended the event |
Turnout | The percentage of total attendees out of total registrations |
Revenue Influenced Timeline
This table can be used for tracking the movement of the influenced opportunities for the next 90 days and other details.
Name | Description |
Account Name | Name of the Account in SFDC |
Opportunity Name | The opportunity name in SFDC |
Opportunity Size | The deal amount of the opportunity |
Account Owner | Name of the Account Owner in SFDC |
Event Start Stage | Opportunity stage at the start of the event |
Current Stage | Current opportunity stage |
Week # | Opportunity stages in each week from week 1 to week 13 |
Revenue Generated Timeline
This table can be used to track the movement of the generated opportunities for the next 90 days and other details.
Name | Description |
Account Name | Name of the Account in SFDC |
Opportunity Name | The opportunity name in SFDC |
Opportunity Size | The deal amount of the opportunity |
Account Owner | Name of the Account Owner in SFDC |
Current Stage | Current opportunity stage |
Week# | Opportunity stages in each week from week 1 to week 13 |
Industry Wise Opportunities
Opportunity details based on the industry of the attendees. This includes a certain time range and win rate.
Name | Description |
Industry | The industry of the attendee |
Opportunity Influenced Count | The total number of influenced opportunities in the pipeline |
Opportunity Influenced Value | The total value of influenced opportunities in the pipeline |
Closed Won Under 30 days | The total number of influenced opportunities in the pipeline that were closed-won under 30 days |
Closed Won between 31 to 60 days | The total number of influenced opportunities in the pipeline that were closed-won between 31 to 60 days |
Closed Won between 61 to 90 days | The total number of influenced opportunities in the pipeline that were closed-won between 61 to 90 days |
Closed Won after 90 days | The total number of influenced opportunities in the pipeline that were closed-won 90 days |
Win Rate | The total number of closed won generated opportunity in the pipeline by the total number of closed won influenced opportunity in the pipeline |
Opportunity Generated Count | The total number of generated opportunities in the pipeline |
Opportunity Generated Value | The total value of generated opportunities in the pipeline |
Closed Won Under 30 days | The total number of generated opportunities in the pipeline that were closed-won under 30 days |
Closed Won between 31 to 60 days | The total number of generated opportunities in the pipeline that were closed-won between 31 to 60 days |
Closed Won between 61 to 90 days | The total number of generated opportunities in the pipeline that were closed-won between 61 to 90 days |
Closed Won after 90 days | The total number of generated opportunities in the pipeline that were closed-won 90 days |
Country Wise Opportunities
Opportunity details based on the country of the attendees. This includes a certain time range and win rate. Refer to the industry-wise opportunity table for descriptions.
Session Wise Opportunities
Opportunity details based on attended sessions in your event. This includes a certain time range and win rate. Refer to the industry-wise opportunity table for descriptions.
Account type Wise Opportunities
Opportunity details based on account. This includes a certain time range and win rate. Refer to the industry-wise opportunity table for descriptions.
Account CTA Details
Account-level details of Contacts who clicked on a CTA in a Zuddl event.
Name | Description |
Account Owner | Name of the account owner in SFDC |
Account Name | Name of the account in SFDC |
Account Type | Type of account in SFDC. For example, Customer - Direct, Customer - Channel |
Contact Count Clicking Call to Action | The number of times contacts from the account clicked the CTA. |
Lead CTA details
Leads who clicked the CTA and respective lead owners, including click count.
Name | Description |
Lead Owner | The name of the lead owner |
Lead Clicking Call to Action | The number of times the lead clicked the CTA |
Owner Level Details
A leaderboard of the account owners who brought in registrations for the event.
Name | Description |
Account Owner | Name of the account owner in SFDC |
Total Accounts | Total number of accounts assigned to the owner apart from closed lost |
Total Contact | Total number of contacts in such accounts |
Account Registered | Total number of accounts registered |
Accounts Attended | Total number of accounts attended |
Contacts Registered | The total number of contacts who registered from these accounts |
Contacts Attended | The total number of contacts who attended |
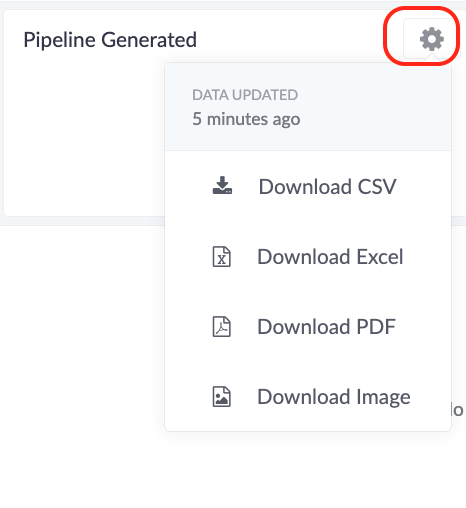
More options
Each metric has a settings button on their respective cards. You get the following options:
Download CSV
Download Excel
Download PDF
Download Image
Syncing the data
The dashboard lets you sync data once every 24 hours using the sync button. The last sync date and time are shown near the Sync now button.
Note: Syncing before the 24-hour window is disabled.